You are using an out of date browser. It may not display this or other websites correctly.
You should upgrade or use an alternative browser.
You should upgrade or use an alternative browser.
Another Political Test
- Thread starter IndigoSensor
- Start date
More options
Who Replied?Lerxst
Well-known member
- MBTI
- INFJ
Political compass
I almost don't want to post it in this section since the test is more or less a real thing... but it's still an online test, for whatever that's worth.
Here's the link for those interested: http://www.politicalcompass.org/test
Post your results and see how we all compare (click on "printable graph" and then just drag, copy & paste the whole page)!
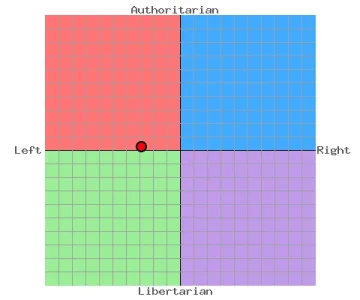
[h=1]The Political Compass[/h][h=2]Economic Left/Right: -8.88
Social Libertarian/Authoritarian: -7.44[/h]
Lerxst
Well-known member
- MBTI
- INFJ
Here's an interesting detail that shows the general balance of states/senators as of 2008 at least:

What's scary is that even the Democrats (blue dots) in the United States still lean way to the Right on the spectrum. Even Obama ranks up there on the Authoritarian/Right scale and people in this country give him shit for his Liberal views.
What's scary is that even the Democrats (blue dots) in the United States still lean way to the Right on the spectrum. Even Obama ranks up there on the Authoritarian/Right scale and people in this country give him shit for his Liberal views.
Radiantshadow
Urban shaman
- MBTI
- Human
- Enneagram
- Human
Your political compass
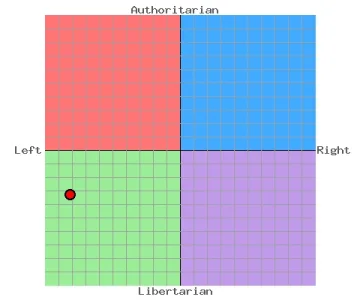
Economic Left/Right: -1.88
Social Libertarian/Authoritarian: -6.97

Economic Left/Right: -1.88
Social Libertarian/Authoritarian: -6.97
magister343
Permanent Fixture
- MBTI
- INTP
- Enneagram
- stupid system (5w4)
You can see my results from my signature. I don't feel like taking the test all over again at the moment.
invisible
On Holiday
- MBTI
- none
Lerxst
Well-known member
- MBTI
- INFJ
A lot of people tend to assume they're in one direction more than the other, until they think about the specifics. I also think that has a lot to do with the political direction this country (US) has taken as well. Saying "socialist" or "liberal" still has a bad connotation for some, so they just assume their more of a "moderate".
Unfortunately, if they assume they're at a 0/0 and most of the candidates running are at a +/+ (Blue) then they compromise and settle for the least +/+ of them all. I'd like to think if people realized they ranked highly in one of the "-" scores, they'd start to consider one of the "other" parties or more extreme candidates for office instead. If you averaged out an extreme -/- candidate with the +/+ influence already in Washington, then you'd end up with a more "moderate" candidate in the end.
If Ron Paul won the presidential vote in 2008, it wouldn't mean we'd all be gun toting, trigger-happy militia members today. It just means the scale would have slid down towards the more Libertarian end, but not changed the entire country overnight. If Kucinich won the race in 2008, it doesn't mean we'd all be granola eating, tree hugging hippies either; we'd just be a lot closer to that center mark today.
Here's the one picture I feel sums up US politics perfectly:
View attachment 8210
TheLinda
Newbie
- MBTI
- INFJ
- Enneagram
- INFJ
GracieRuth
Permanent Fixture
- MBTI
- INFJ
- Enneagram
- 7
- MBTI
- iNfj
- Enneagram
- 9w1
This test came up in TC, so I thought I'd res this thread for a bit to post my results.
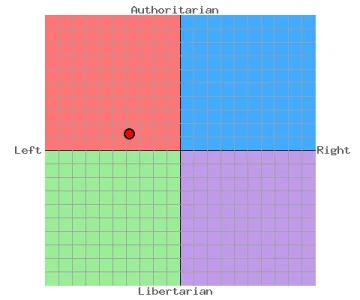
[h=2]Economic Left/Right: -5.88
Social Libertarian/Authoritarian: -8.15[/h]

[h=2]Economic Left/Right: -5.88
Social Libertarian/Authoritarian: -8.15[/h]
Mary Shelley
Fearless & Powerful
- MBTI
- XXXX
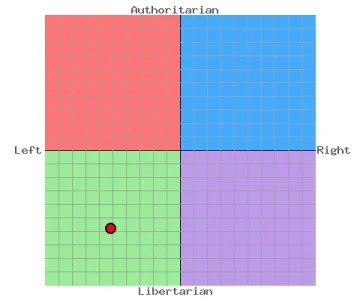
[h=2]Economic Left/Right: -8.50
Social Libertarian/Authoritarian: -8.00[/h]

Social Libertarian/Authoritarian: -8.00[/h]


